[Code and Data]
Let's say you have a text file called workout.csv that contains information about your workouts for the month of March:
:::text
# date, kind of workout, distance (miles), time (min)
"2012, Mar-01", run, 2, 25
"2012, Mar-03", bike, 10, 55
"2012, Mar-06", bike, 5, 20
"2012, Mar-09", run, 3, 42
"2012, Mar-10", skateboarding, 2, 10
# Broke my leg :(
"2012, Mar-11", Wii, 0, 60
"2012, Mar-12", Wii, 0, 60
"2012, Mar-13", Wii, 0, 60
"2012, Mar-14", Wii, 0, 60
It's a common-separated value (CSV) file, but contains comments and blank lines. The first line (a comment) describes the fields in this file, which are (from left to right) the date of your workout, the kind of workout, how many miles you traveled, and how many minutes you spent (note: I didn't actually break my leg, it's just an example!).
Our goal will be to read this data into Python and plot a graph with the day of the month on the x-axis and the time worked out on the y-axis. Let's get started.
1. Reading
----------
To begin, let's read in the data file with Python's csv module. The code is fairly straightforward:
:::python
import csv
# Read in all rows from the csv file
reader = file("workout.csv", "r")
csv_reader = csv.reader(reader)
# Print out rows
for row in csv_reader:
print row
Saving this code to a file called plot\_workouts.py and running python plot\_workouts.py on the command-line produces the following output:
:::text
['# date', ' kind of workout', ' distance (miles)', ' time (min)']
['2012, Mar-01', ' run', ' 2', ' 25']
['2012, Mar-03', ' bike', ' 10', ' 55']
['2012, Mar-06', ' bike', ' 5', ' 20']
['2012, Mar-09', ' run', ' 3', ' 42']
['2012, Mar-10', ' skateboarding', ' 2', ' 10']
[]
['# Broke my leg :(']
[]
['2012, Mar-11', ' Wii', ' 0', ' 60']
['2012, Mar-12', ' Wii', ' 0', ' 60']
['2012, Mar-13', ' Wii', ' 0', ' 60']
['2012, Mar-14', ' Wii', ' 0', ' 60']
Unfortunately, as we can see, Python's CSV reader doesn't filter out comments or blank lines. We'll need to do it manually. However, this is a common task that we might want to do again and again across programs. Let's write a function named filter\_lines that will filter the lines in a file before the CSV reader does its thing.
:::python
def filter_lines(reader)
lines = []
for line in reader:
if len(line.strip()) > 0 or not line.startswith("#"):
lines.append(line)
return lines
This function will take a file reader and return a list of lines (excluding blank lines and comments). Let's make filter\_lines a bit more readable by introducing a second function called keep\_line:
:::python
def keep_line(line):
return len(line.strip()) > 0 or not line.startswith("#"):
def filter_lines(reader)
lines = []
for line in reader:
if keep_line(line):
lines.append(line)
return lines
This new code is easier to read. We can see that keep\_line takes in a line and will return True when the line is not blank and not a comment. Here's the complete code so far:
:::python
import csv
#------------------------------------------------------------
def keep_line(line):
return len(line.strip()) > 0 and not line.startswith("#")
#------------------------------------------------------------
def filter_lines(reader):
lines = []
for line in reader:
if keep_line(line):
lines.append(line)
return lines
#------------------------------------------------------------
reader = file("workout.csv", "r")
lines = filter_lines(reader)
csv_reader = csv.reader(lines)
for row in csv_reader:
print row
Running this now produces the following output:
:::text
['2012, Mar-01', ' run', ' 2', ' 25']
['2012, Mar-03', ' bike', ' 10', ' 55']
['2012, Mar-06', ' bike', ' 5', ' 20']
['2012, Mar-09', ' run', ' 3', ' 42']
['2012, Mar-10', ' skateboarding', ' 2', ' 10']
['2012, Mar-11', ' Wii', ' 0', ' 60']
['2012, Mar-12', ' Wii', ' 0', ' 60']
['2012, Mar-13', ' Wii', ' 0', ' 60']
['2012, Mar-14', ' Wii', ' 0', ' 60']
Hooray! Our blank lines and comments are gone. Before moving on to parsing the data (converting it from text to dates, integers, etc.), let's take a moment to think about how Python is actually using our filter\_lines and keep\_line functions. For that, we need to understand the call stack
2. The Call Stack
-----------------
Python tracks which functions are currently being executed with a data structure named the call stack. When Python encounters a function call, like lines = filter\_lines(reader), it "pushes" information about where to come back to and then jumps to the function's code. When a return statement is found (or when the function ends), Python "pops" information off call stack to remember where it was.
This can be difficult to visualize. Below is a diagram of our program before and after the call to filter\_lines.
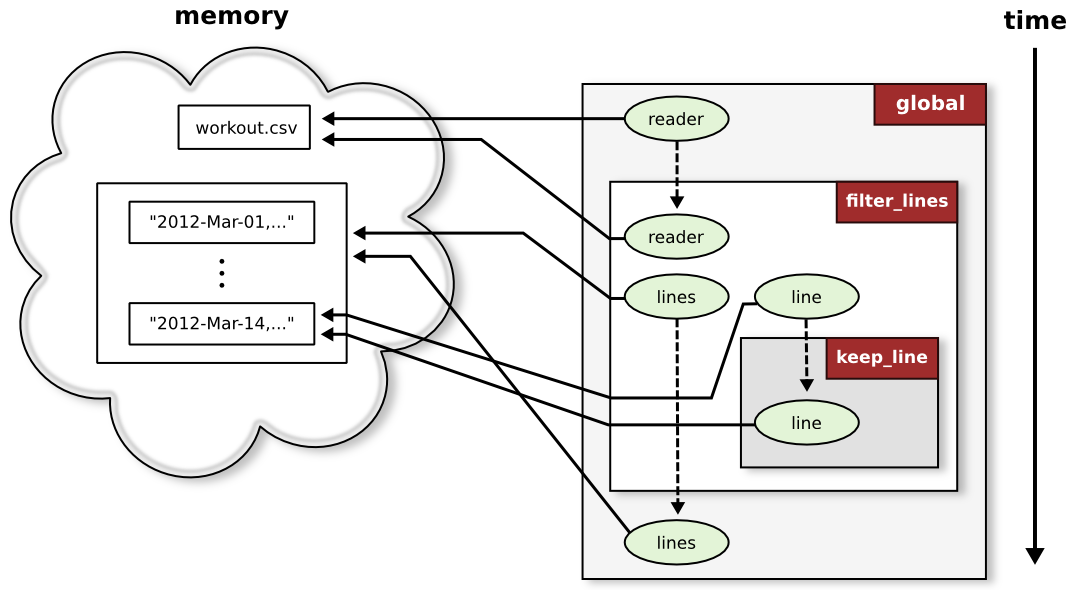
Python starts out in the "global" function whose code is just the main body of your program. When we call filter\_lines with reader as a parameter, Python copies a reference
to workout.csv into a new variable reader, makes a note that it should return to the global function, and jumps to the code for filter\_lines. Each time we call keep\_line inside filter\_lines, Python saves its place on the call stack, copies a reference to line, jumps to keep\_line, and jumps back to filter\_lines when it's done.
It's important to remember that the reader in the global function and the reader in filter\_lines are two different variables. However, they point to the same file in memory, so reading from the file inside of filter\_lines changes the file position of reader in the global function.
Python copies things by reference instead of by value, which is very fast (it only needs to point the new variable at the right thing in memory). It can lead to confusion, however, if you don't expect a function to make changes to a parameter (e.g., trying to read data from reader after calling filter\_lines produces nothing since we're at the end of the file). If you really need to, making copies is easy. A list named my\_list, for example, can be copied simply by slicing the whole thing my\_list[:].
With a picture of the call stack in our heads, let's move on to parsing our workout data.
3. Parsing
----------
Our workout data is stored as text. In order to process and plot it, we need to convert each field to its appropriate type (e.g., a date, an integer, etc.). Converting from text to integers or floating point numbers is easy; we can just call the int() or float() function. Our first field is a date, however, which requires a bit more work.
Parsing dates can get hairy very quickly. Luckily, the hard work has already been done for us! Python includes module called datetime that handles parsing for dates and times (go figure ;)).
3.1 The datetime module
The datetime module contains a class also called datetime. This class has a lot of useful functions for date manipulation as well as a function called strptime for parsing (think "string parse time" for strptime).
datetime.strptime takes two parameters: (1) a date string like "2012, Mar-01", and (2) a format string that describes how to parse the date string.
We make a format string by replacing the pieces of our date string with special format codes (which start with a '%'). For example, %Y stands for the "year with century as a decimal number", so we need to replace the year in our date string (2012) with %Y as such: "%Y, Mar-01". Next, we use the %b (abbreviated month name) and %d (day of the month) format codes to replace the remaining pieces ("Mar" and "01", respectively). Our final format string is "%Y, %b-%d". Note that we include the comma, space, and dash.
Let's write a function called parse\_workouts that will take in a list of CSV rows and produce a list of workouts (one for each row). Each workout will itself be a list with the parsed date, workout kind, distance, and time. The complete code is below.
:::python
import csv
from datetime import datetime
#------------------------------------------------------------
def keep_line(line):
return len(line.strip()) > 0 and not line.startswith("#")
#------------------------------------------------------------
def filter_lines(reader):
lines = []
for line in reader:
if keep_line(line):
lines.append(line)
return lines
#------------------------------------------------------------
def parse_workouts(rows):
workouts = []
for row in rows:
date = datetime.strptime(row[0], "%Y, %b-%d")
kind = row[1].strip()
distance = int(row[2])
time = int(row[3])
workouts.append([date, kind, distance, time])
return workouts
#------------------------------------------------------------
reader = file("workout.csv", "r")
lines = filter_lines(reader)
csv_reader = csv.reader(lines)
workouts = parse_workouts(csv_reader)
for w in workouts:
print w
At the top, we import the datetime class from the datetime module using Python's from module import class import form. Our parse\_workouts function loops over each CSV row, parses the individual fields, and packages them up as a single workout list. At the end, we print out our workouts.
Running this code produces the following output:
:::text
[datetime.datetime(2012, 3, 1, 0, 0), 'run', 2, 25]
[datetime.datetime(2012, 3, 3, 0, 0), 'bike', 10, 55]
[datetime.datetime(2012, 3, 6, 0, 0), 'bike', 5, 20]
[datetime.datetime(2012, 3, 9, 0, 0), 'run', 3, 42]
[datetime.datetime(2012, 3, 10, 0, 0), 'skateboarding', 2, 10]
[datetime.datetime(2012, 3, 11, 0, 0), 'Wii', 0, 60]
[datetime.datetime(2012, 3, 12, 0, 0), 'Wii', 0, 60]
[datetime.datetime(2012, 3, 13, 0, 0), 'Wii', 0, 60]
[datetime.datetime(2012, 3, 14, 0, 0), 'Wii', 0, 60]
Each workout is a list whose first element is a datetime.datetime object. Python prints datetime objects as datetime.datetime(year, month, day, hour, second). The second element is the kind of workout (a string). The third and fourth elements are the workout distance and time, respectively (both integers).
Everything is looking good, so let's prepare for plotting. We want to plot the day of the month on the x-axis and the time we worked out on the y-axis. We'll write two functions, one to extract the day of the month from each workout, and another to extract the time from each workout.
:::python
import csv
from datetime import datetime
#------------------------------------------------------------
def keep_line(line):
return len(line.strip()) > 0 and not line.startswith("#")
#------------------------------------------------------------
def filter_lines(reader):
lines = []
for line in reader:
if keep_line(line):
lines.append(line)
return lines
#------------------------------------------------------------
def parse_workouts(rows):
workouts = []
for row in rows:
date = datetime.strptime(row[0], "%Y, %b-%d")
kind = row[1].strip()
distance = int(row[2])
time = int(row[3])
workouts.append([date, kind, distance, time])
return workouts
#------------------------------------------------------------
def extract_days(workouts):
days = []
for w in workouts:
date = w[0]
days.append(date.day)
return days
#------------------------------------------------------------
def extract_times(workouts):
times = []
for w in workouts:
times.append(w[3])
return times
#------------------------------------------------------------
reader = file("workout.csv", "r")
lines = filter_lines(reader)
csv_reader = csv.reader(lines)
workouts = parse_workouts(csv_reader)
days = extract_days(workouts)
times = extract_times(workouts)
print "Days:", days
print "Times:", times
In the extract\_days function, we loop through each workout and append the day field of each datetime object onto a list. See the datetime documentation for a complete list of fields. extract\_times is similar to extract\_days, but grabs the fourth element of each workout list (the workout time) instead.
Running the new code produces a list of days and workout times:
:::text
Days: [1, 3, 6, 9, 10, 11, 12, 13, 14]
Times: [25, 55, 20, 42, 10, 60, 60, 60, 60]
We're now ready to start plotting.
4. Plotting
-----------
There are many plotting libraries available for Python. For this tutorial, we'll stick with one of the most popular libraries based on MATLAB: matplotlib
4.1 Installing matplotlib
matplotlib does not come with the standard Python installation. In addition, it depends on another library called numpy which is also not included. The installing matplotlib page provides detailed instructions for installing matplotlib on Windows, Mac OS X, and Linux. Don't forget to download and install numpy as well.
In order to choose the correct downloads, you need to know which version of Python you're running. At the command-line, run python --version (mine says Python 2.7.2+). The first two numbers (2.7 for me) will give you an idea of which matplotlib file to choose. On Windows, I downloaded the file named "matplotlib-1.1.0.win32-py2.7.exe" because I have Python 2.7 and a 32-bit installation of Python. The numpy downloads are named similarly; I downloaded "numpy-1.6.1-win32-superpack-python2.7.exe".
Once everything is installed, you can check that it's working by running python and typing in the following code:
from matplotlib import pyplot
If no errors are printed, then you should be set.
4.2 Using matplotlib
There are many, many functions in matplotlib. Our program will use the pyplot.plot function, which makes line and scatter plots. This function takes a list of x values, a list of y values, and some options like the line thickness and color. For now, we'll create a function called plot that will create a new figure, plot workout days vs. times, and then save the figure to a file.
:::python
import csv
from datetime import datetime
from matplotlib import pyplot
#------------------------------------------------------------
def keep_line(line):
return len(line.strip()) > 0 and not line.startswith("#")
#------------------------------------------------------------
def filter_lines(reader):
lines = []
for line in reader:
if keep_line(line):
lines.append(line)
return lines
#------------------------------------------------------------
def parse_workouts(rows):
workouts = []
for row in rows:
date = datetime.strptime(row[0], "%Y, %b-%d")
kind = row[1].strip()
distance = int(row[2])
time = int(row[3])
workouts.append([date, kind, distance, time])
return workouts
#------------------------------------------------------------
def extract_days(workouts):
days = []
for w in workouts:
date = w[0]
days.append(date.day)
return days
#------------------------------------------------------------
def extract_times(workouts):
times = []
for w in workouts:
times.append(w[3])
return times
#------------------------------------------------------------
def plot(days, times, filename):
fig = pyplot.figure()
pyplot.plot(days, times)
pyplot.savefig(filename)
#------------------------------------------------------------
reader = file("workout.csv", "r")
lines = filter_lines(reader)
csv_reader = csv.reader(lines)
workouts = parse_workouts(csv_reader)
days = extract_days(workouts)
times = extract_times(workouts)
plot(days, times, "workout_times.png")
Running this code will create a new file named workout\_times.png that looks like this:
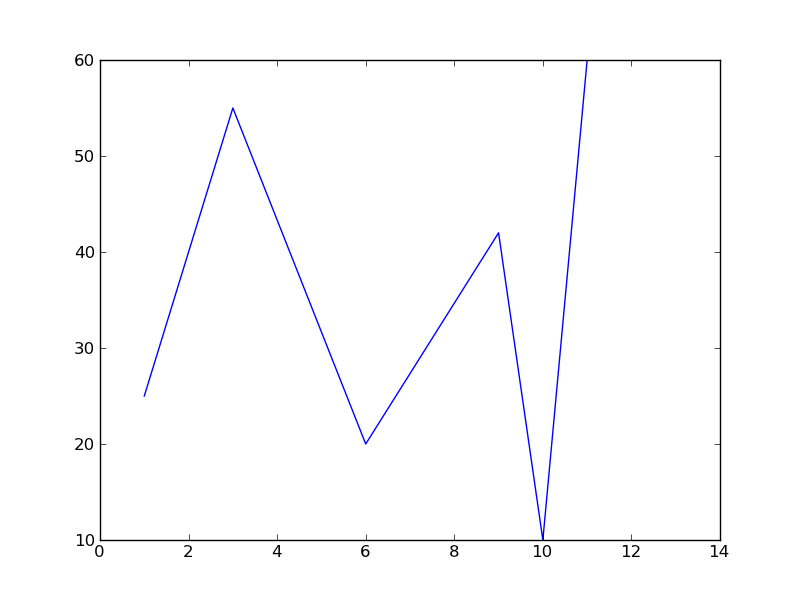
As you can see, matplotlib takes a "no frills" approach by default. We can spruce up our figure by adding a title, axes labels, a grid, and a "tick" on the x-axis for each day (instead of every other day).
:::python
def plot(days, times, filename):
fig = pyplot.figure()
pyplot.title("Times I worked out in March")
pyplot.xlabel("Day")
pyplot.ylabel("Time (min)")
pyplot.xticks(range(1, max(days)+1))
pyplot.grid()
pyplot.plot(days, times, color="red", linewidth=2)
pyplot.savefig(filename)
A complete description of these pyplot functions is beyond the scope of this tutorial. A future tutorial will explore them in detail. For now, we suggest using the matplotlib gallery to get an idea of what each function does.
With the changes above, workout\_times.png is looking a lot nicer:
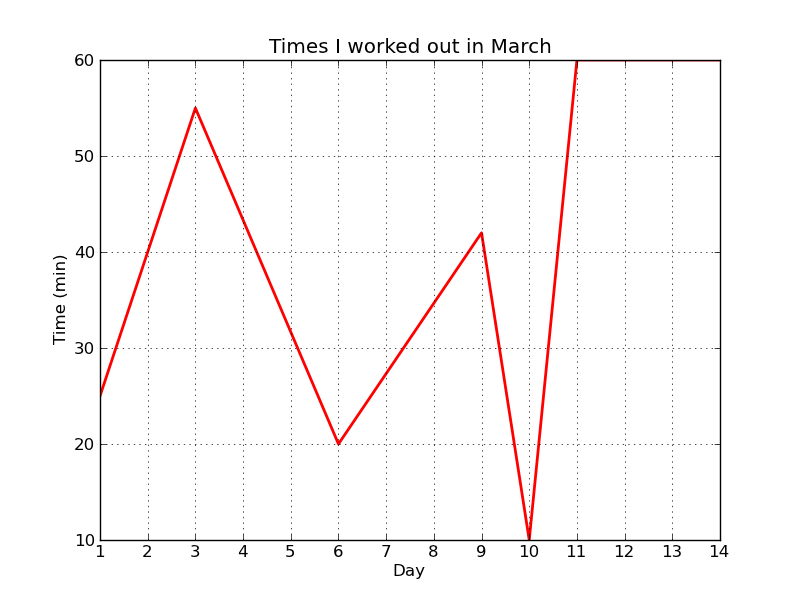
That's all, folks! The complete code looks like this:
:::python
import csv
from datetime import datetime
from matplotlib import pyplot
#------------------------------------------------------------
def keep_line(line):
return len(line.strip()) > 0 and not line.startswith("#")
#------------------------------------------------------------
def filter_lines(reader):
lines = []
for line in reader:
if keep_line(line):
lines.append(line)
return lines
#------------------------------------------------------------
def parse_workouts(rows):
workouts = []
for row in rows:
date = datetime.strptime(row[0], "%Y, %b-%d")
kind = row[1].strip()
distance = int(row[2])
time = int(row[3])
workouts.append([date, kind, distance, time])
return workouts
#------------------------------------------------------------
def extract_days(workouts):
days = []
for w in workouts:
date = w[0]
days.append(date.day)
return days
#------------------------------------------------------------
def extract_times(workouts):
times = []
for w in workouts:
times.append(w[3])
return times
#------------------------------------------------------------
def plot(days, times, filename):
fig = pyplot.figure()
pyplot.title("Times I worked out in March")
pyplot.xlabel("Day")
pyplot.ylabel("Time (min)")
pyplot.xticks(range(1, max(days)+1))
pyplot.grid()
pyplot.plot(days, times, color="red", linewidth=2)
pyplot.savefig(filename)
#------------------------------------------------------------
reader = file("workout.csv", "r")
lines = filter_lines(reader)
csv_reader = csv.reader(lines)
workouts = parse_workouts(csv_reader)
days = extract_days(workouts)
times = extract_times(workouts)
plot(days, times, "workout_times.png")
[Code and Data]